Analytical Insights
Key findings from comprehensive data analysis
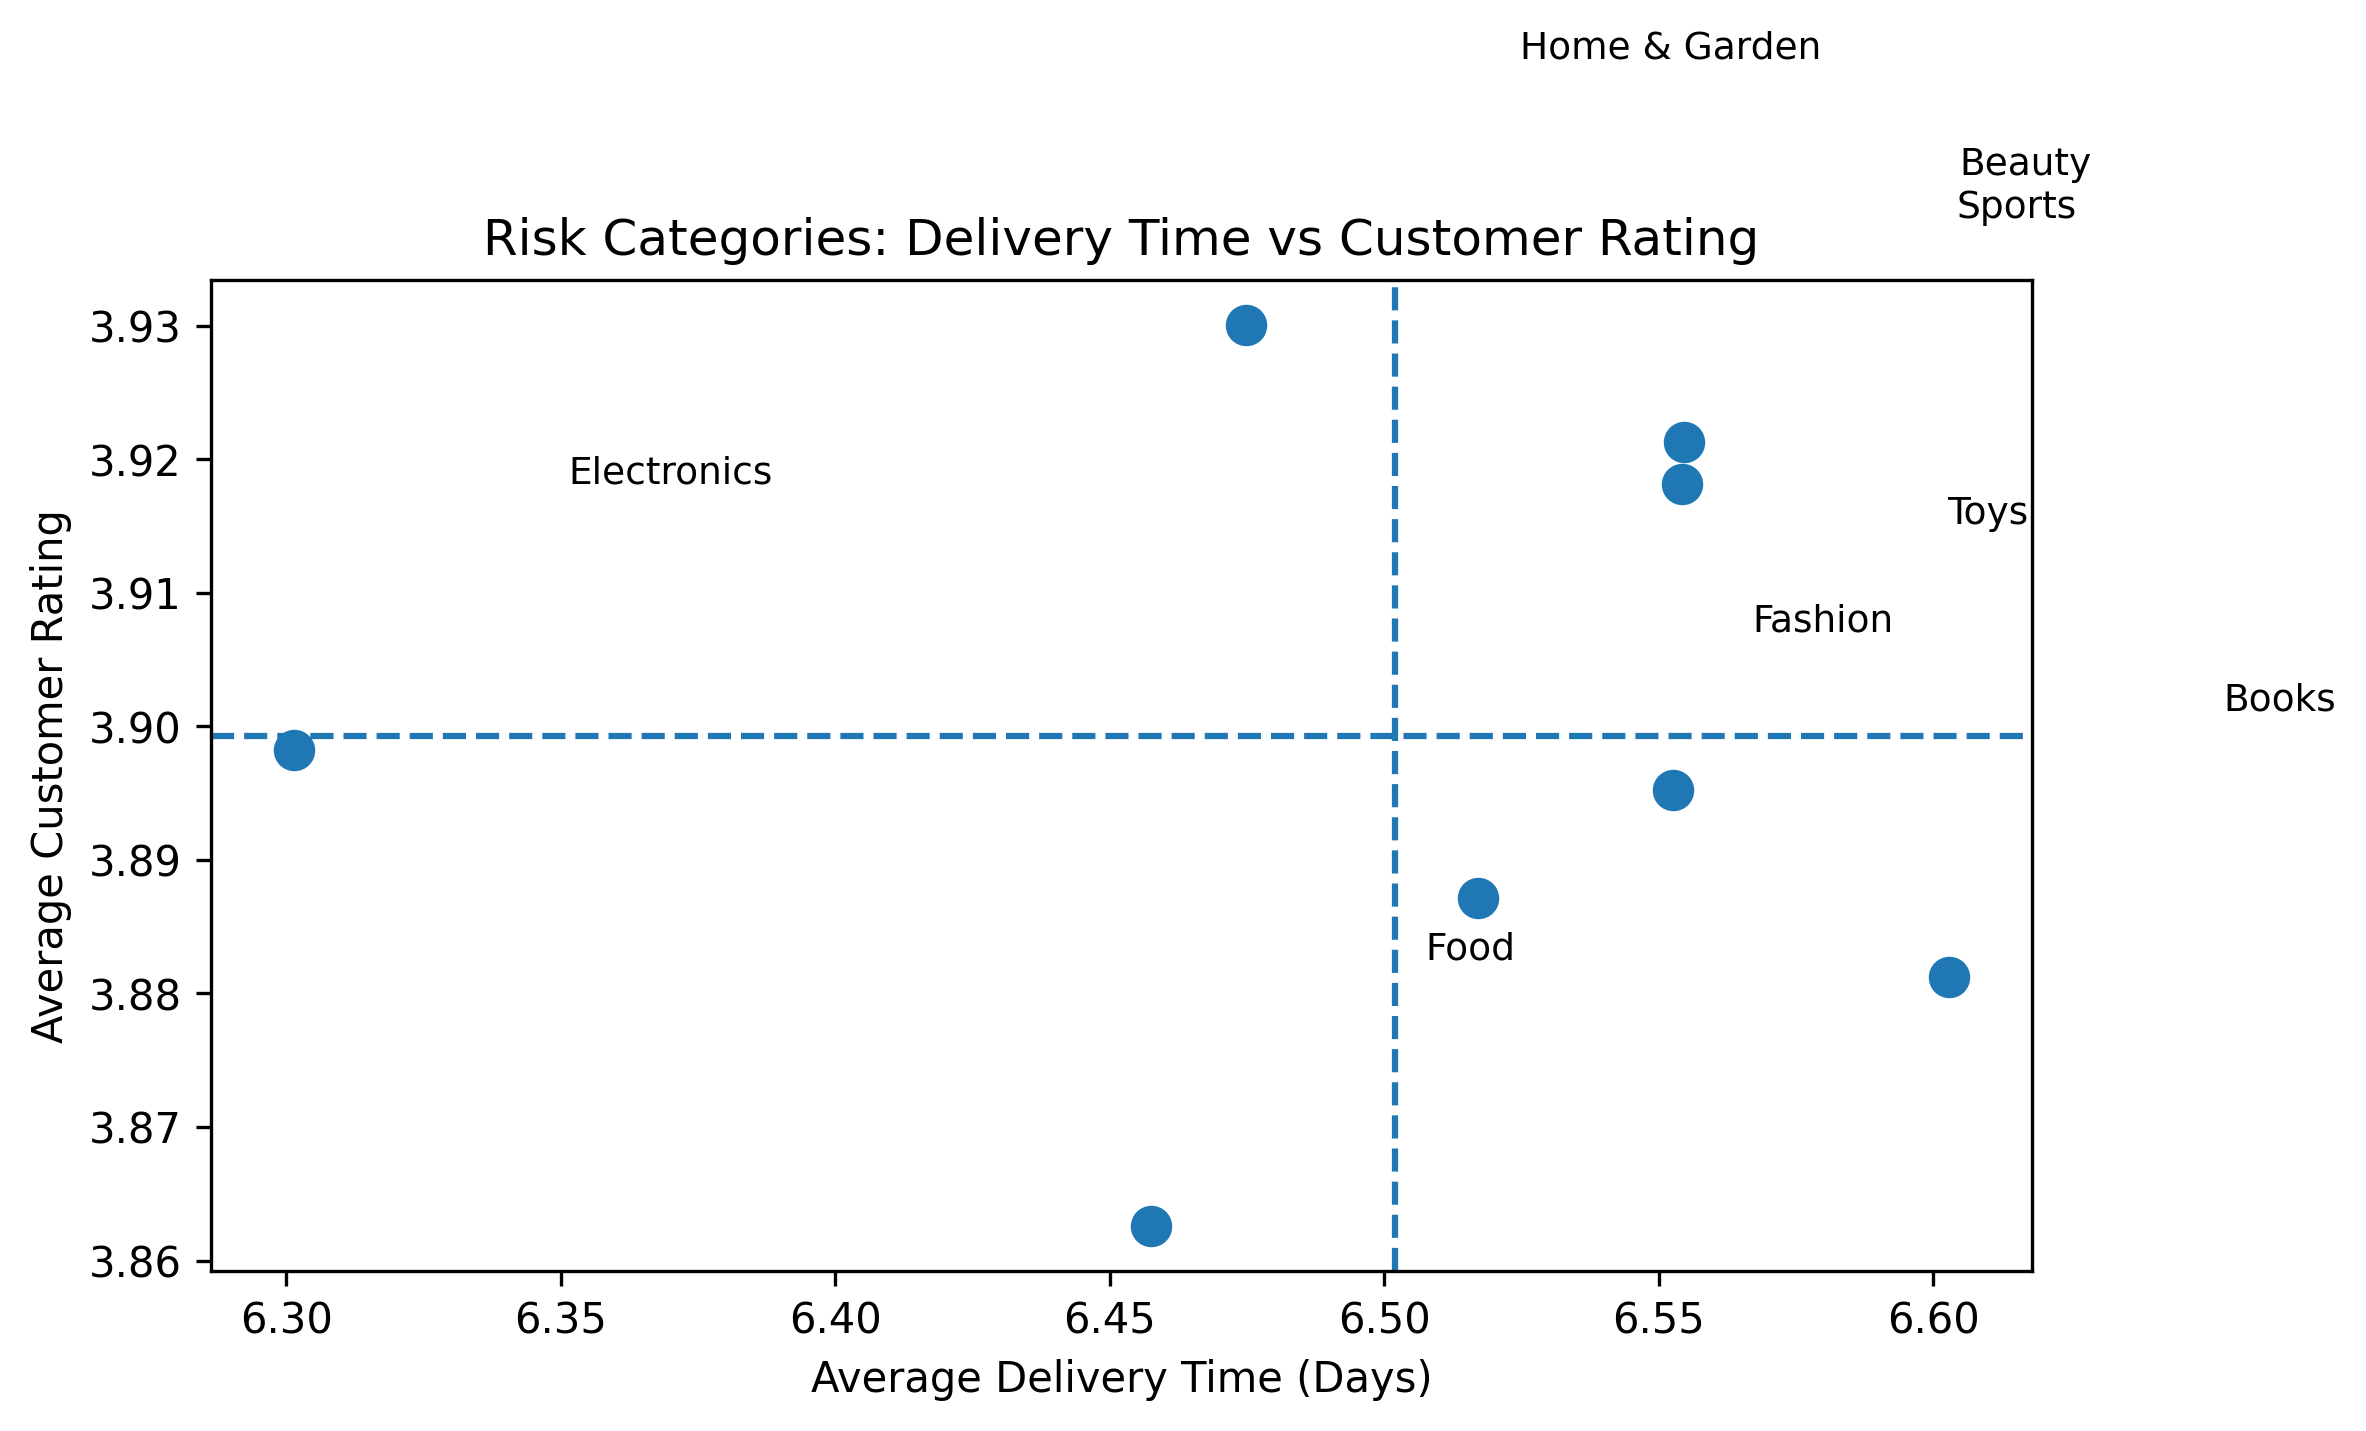
Categories in bottom-right quadrant indicate operational risk
Risk Analysis: Delivery vs Rating
Key Findings:
- Food and Toys categories show slower delivery times and lower ratings
- Electronics maintain optimal balance of delivery time and ratings
- Bottom-right quadrant indicates highest operational risk
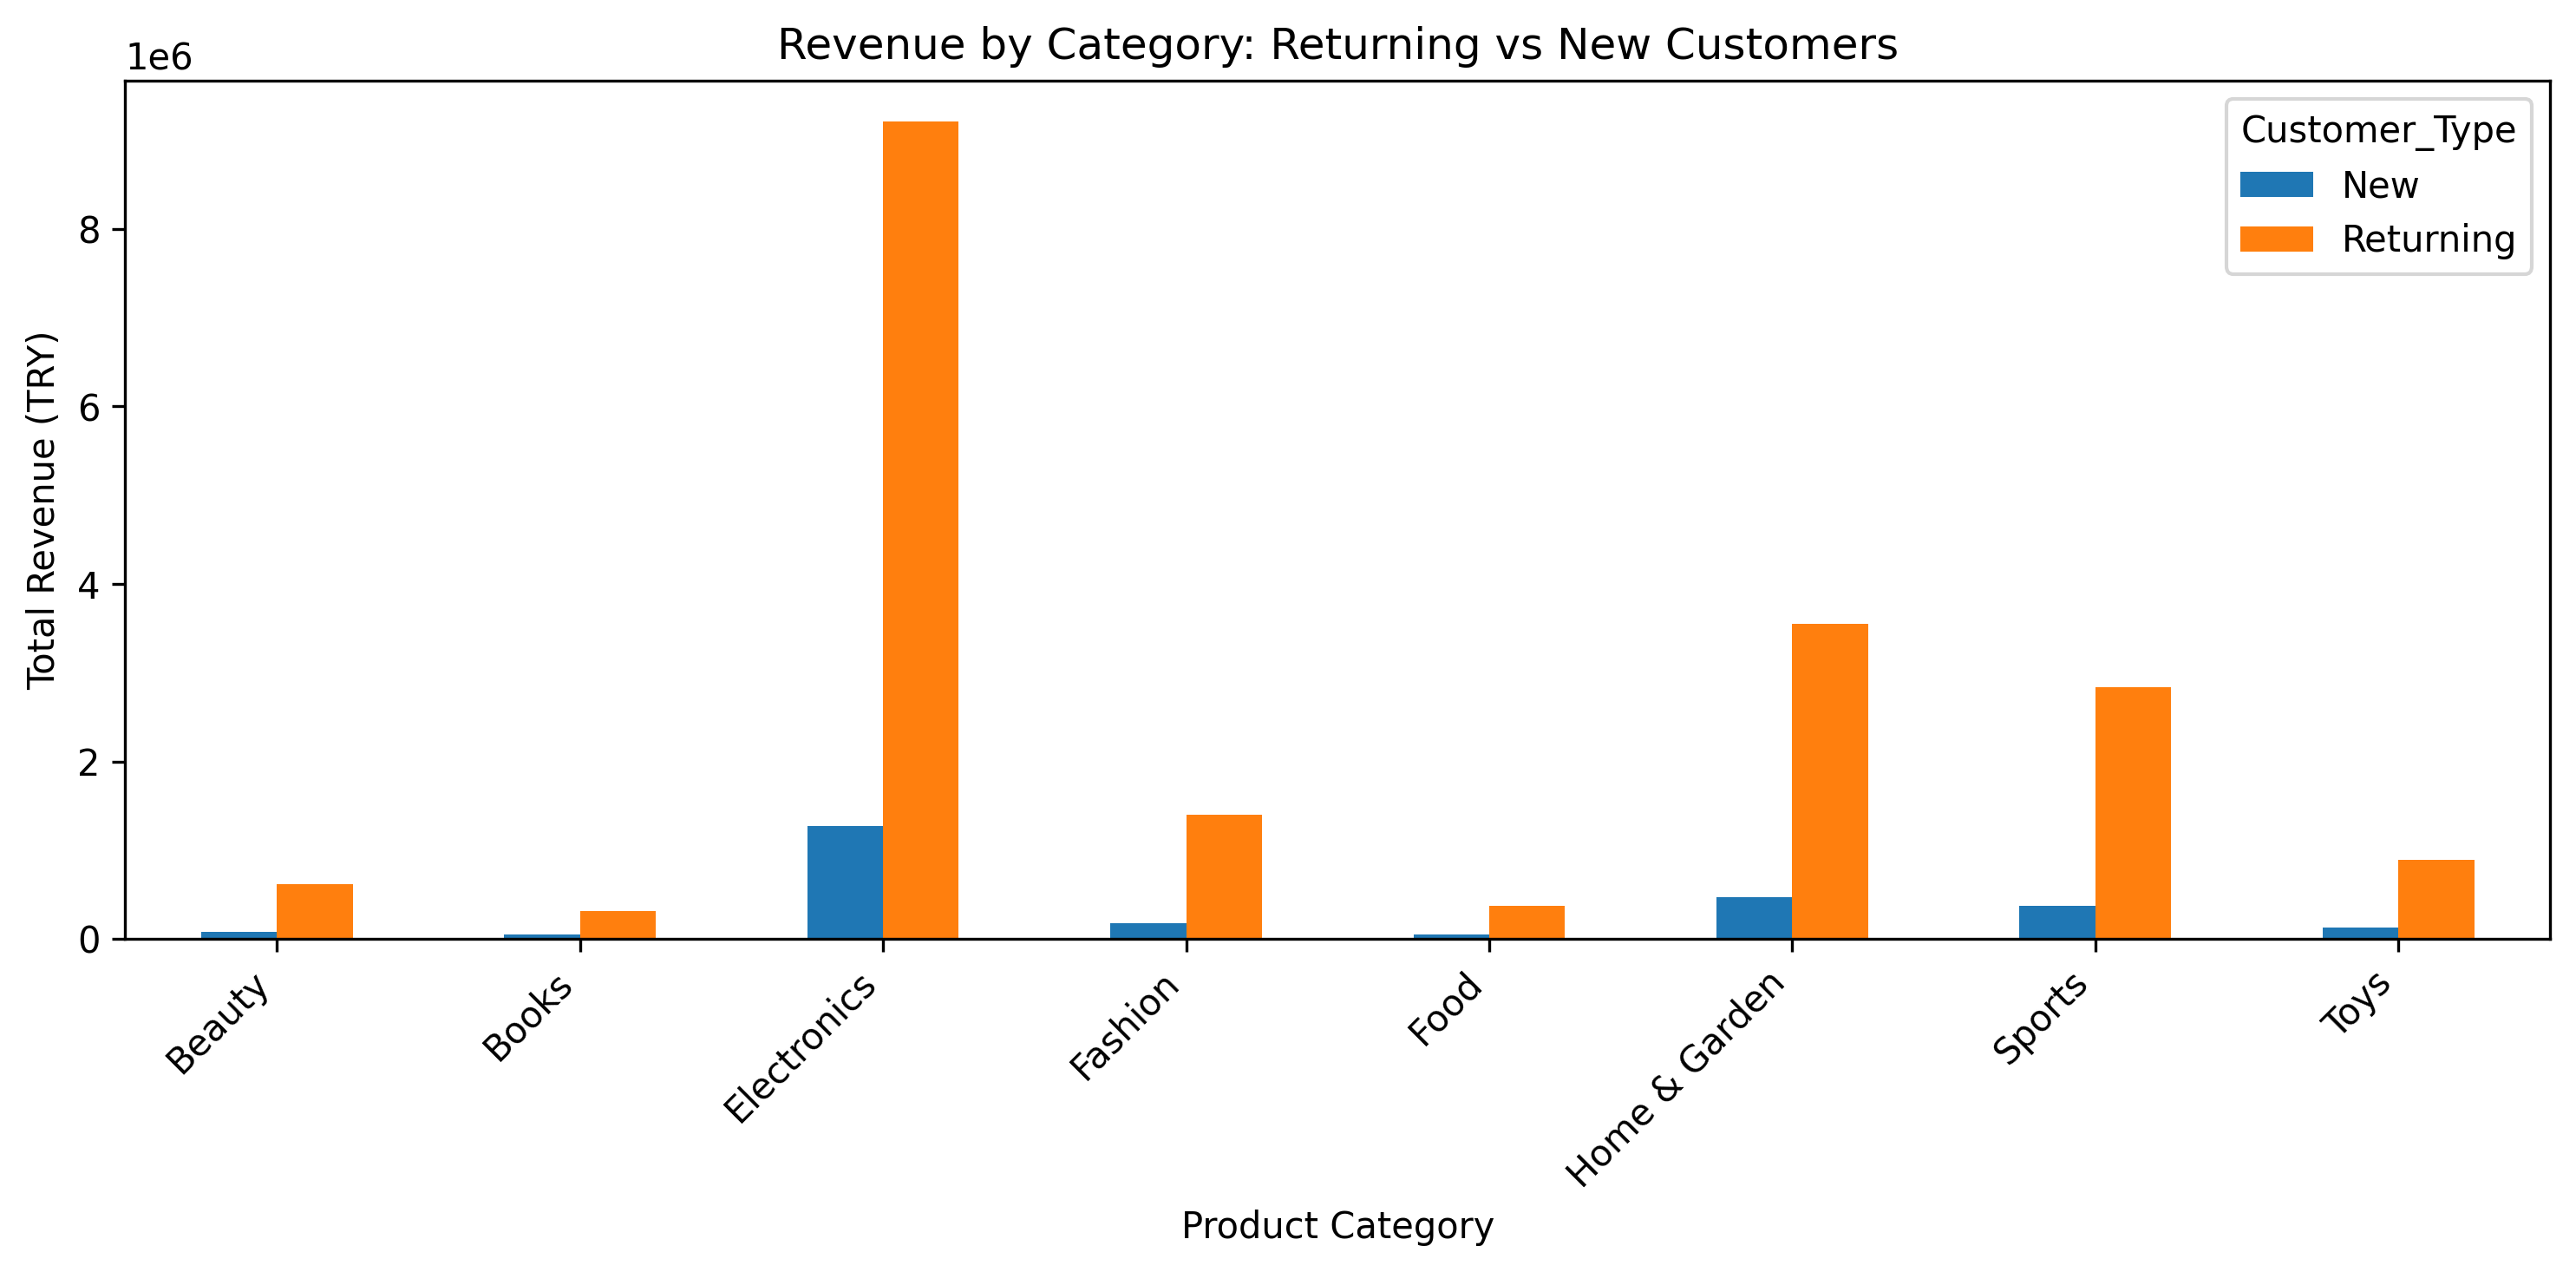
Returning customers dominate revenue across categories
Revenue Analysis: Returning vs New Customers
Key Insights:
- Returning customers generate more revenue than new customers
- Electronics and Home & Garden show highest retention value
- Customer retention is stronger revenue driver than acquisition
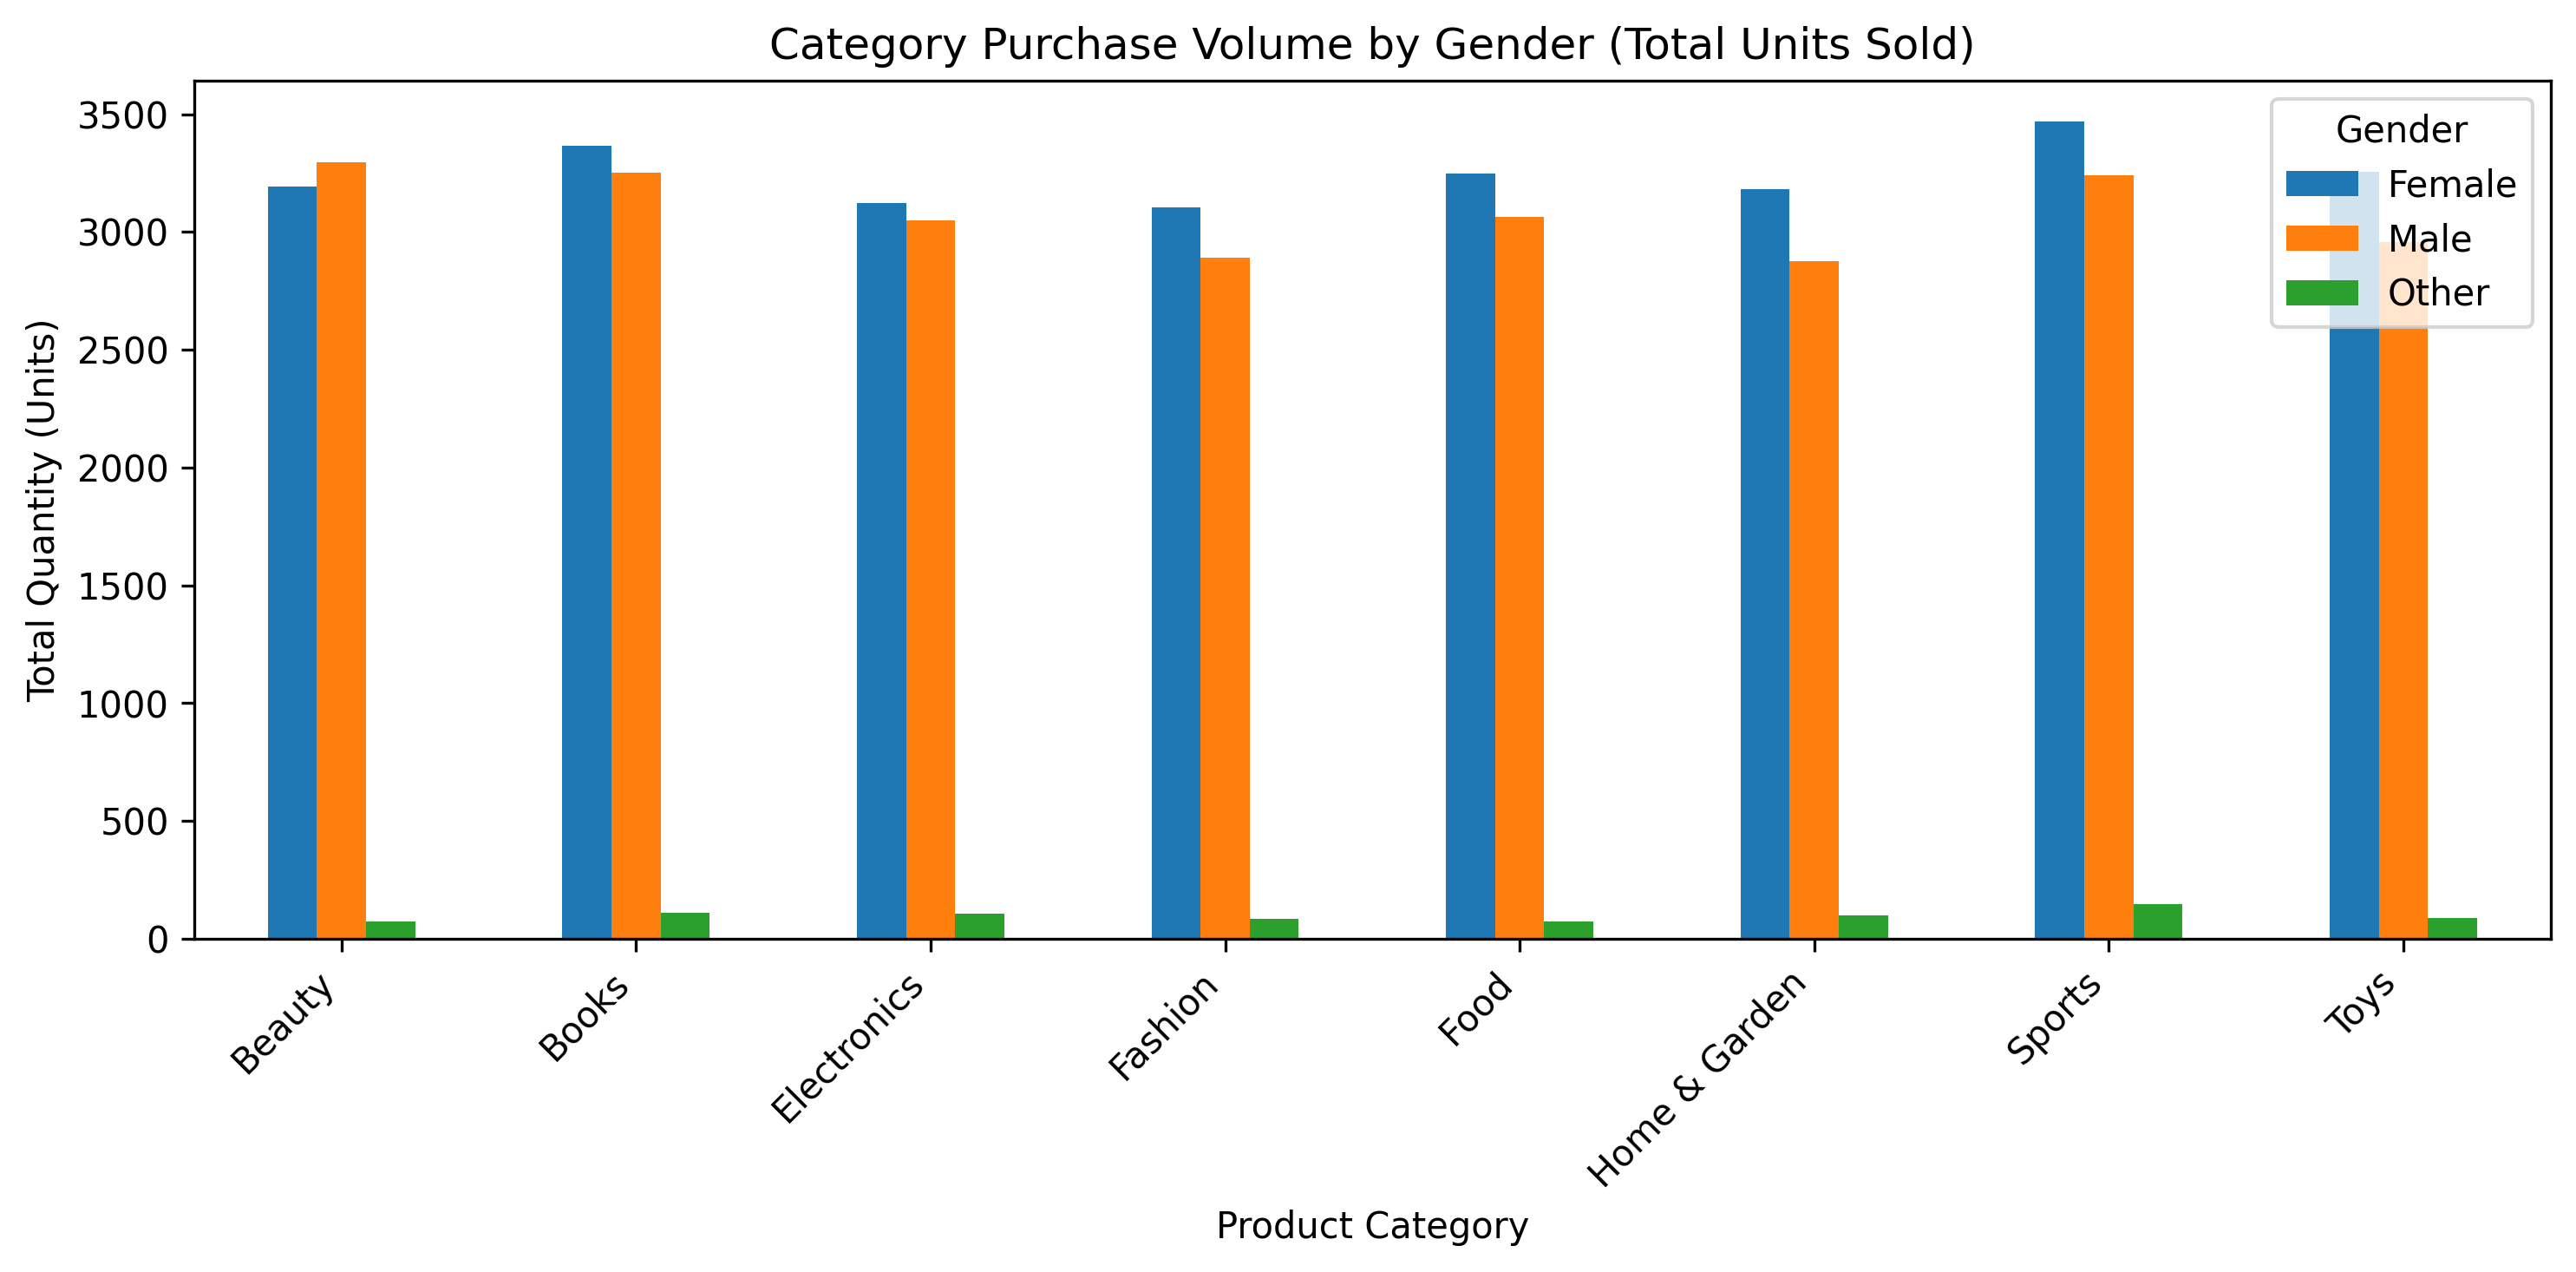
Balanced purchase volume across genders with category variations
Purchase Volume by Gender
Key Findings:
- Overall purchase volume balanced across male and female customers
- Beauty and Fashion show slightly higher female engagement
- Sports and Electronics show slightly higher male engagement
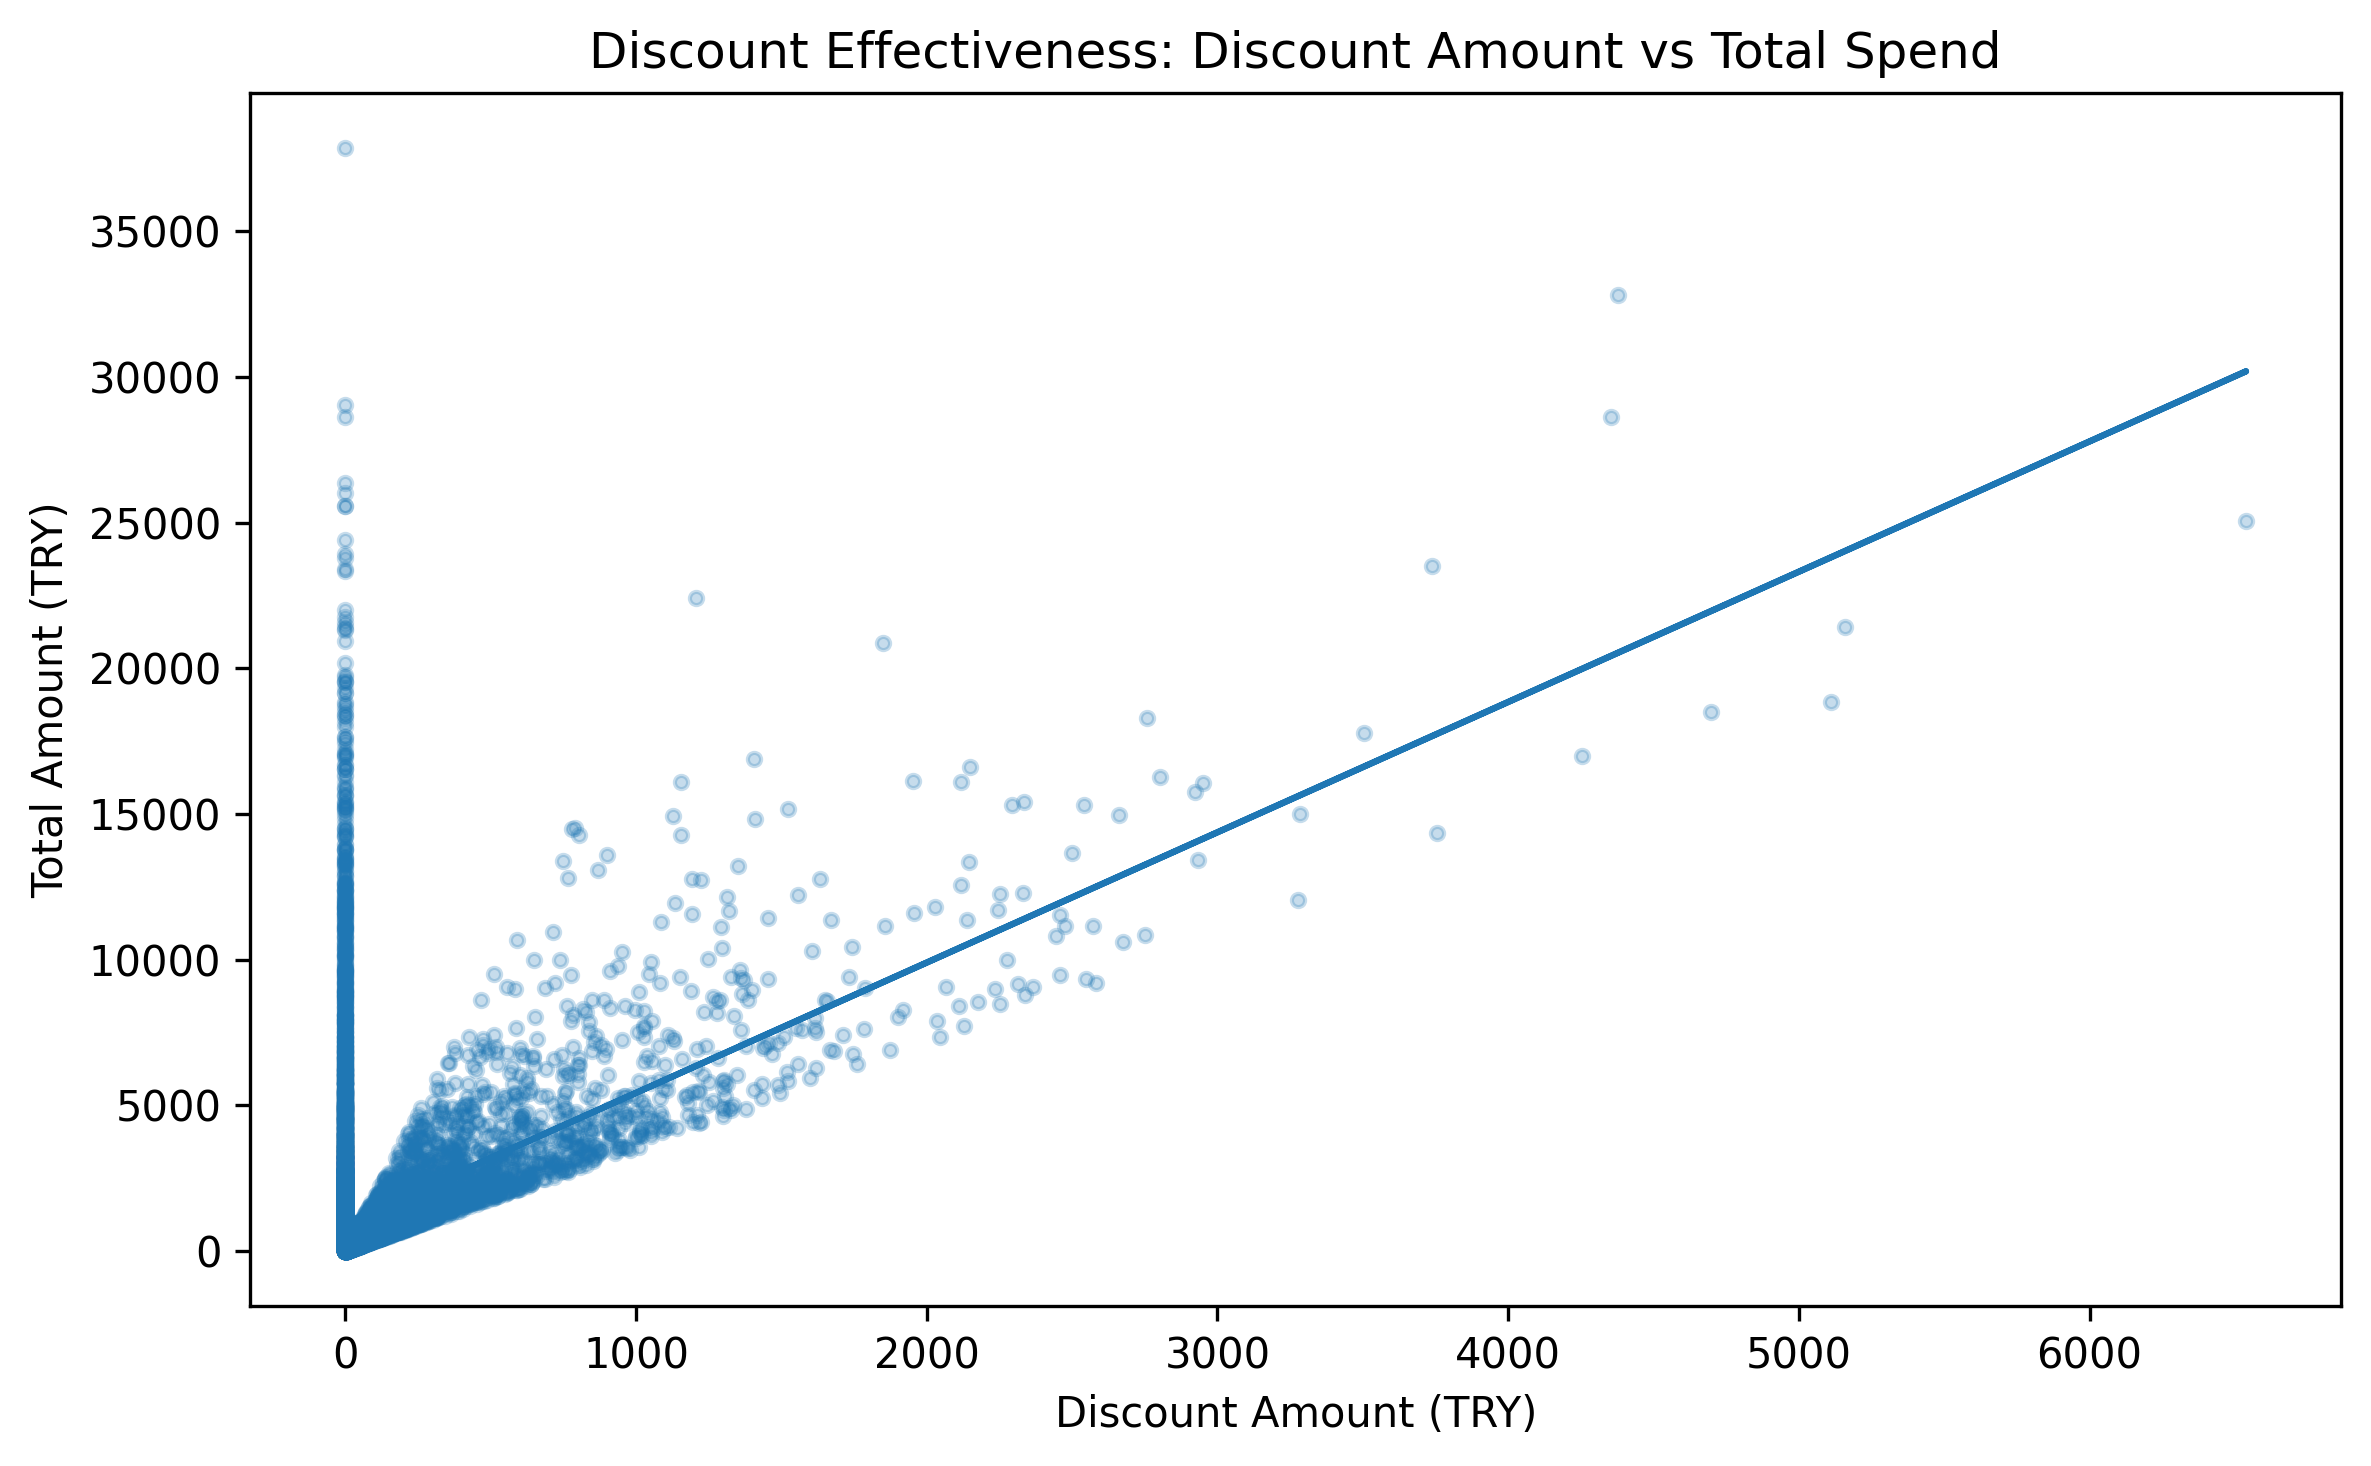
Positive correlation with wide dispersion in spending
Discount Effectiveness Analysis
Key Insights:
- Positive upward trend: higher discounts correlate with higher spending
- Wide dispersion indicates discounts aren't the only spending driver
- Optimal discount range identified for maximum basket size increase
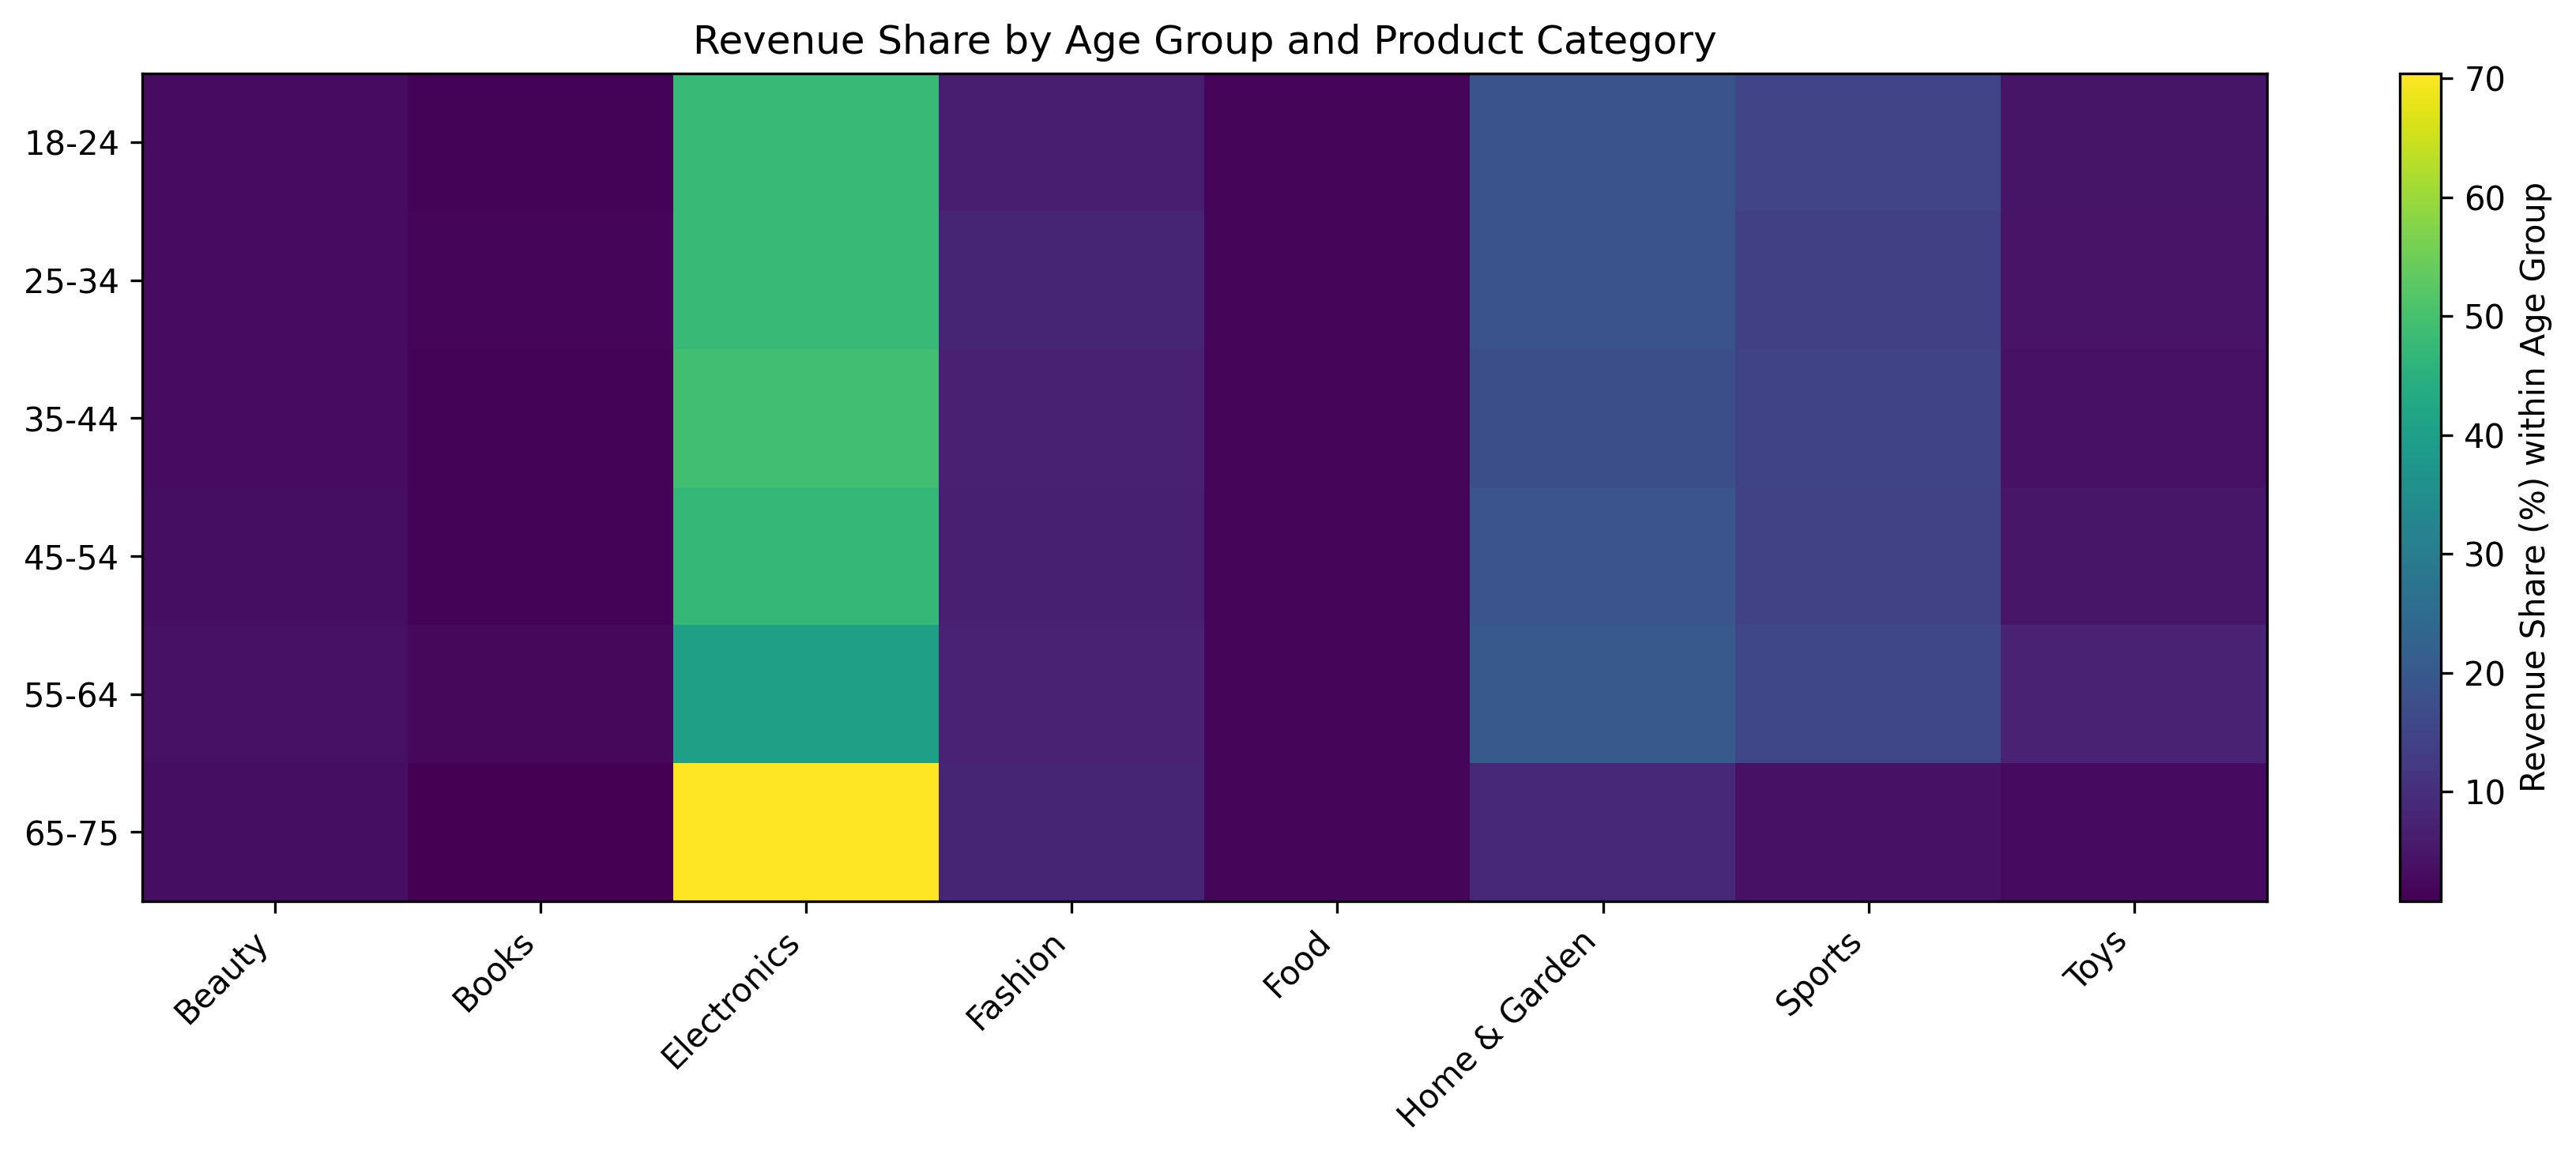
Electronics dominate revenue across all age groups
Age Group Revenue Share Analysis
Key Findings:
- Electronics consistently rank #1 across all age groups
- Revenue share increases with age for Electronics category
- Younger groups show more diversified spending across categories
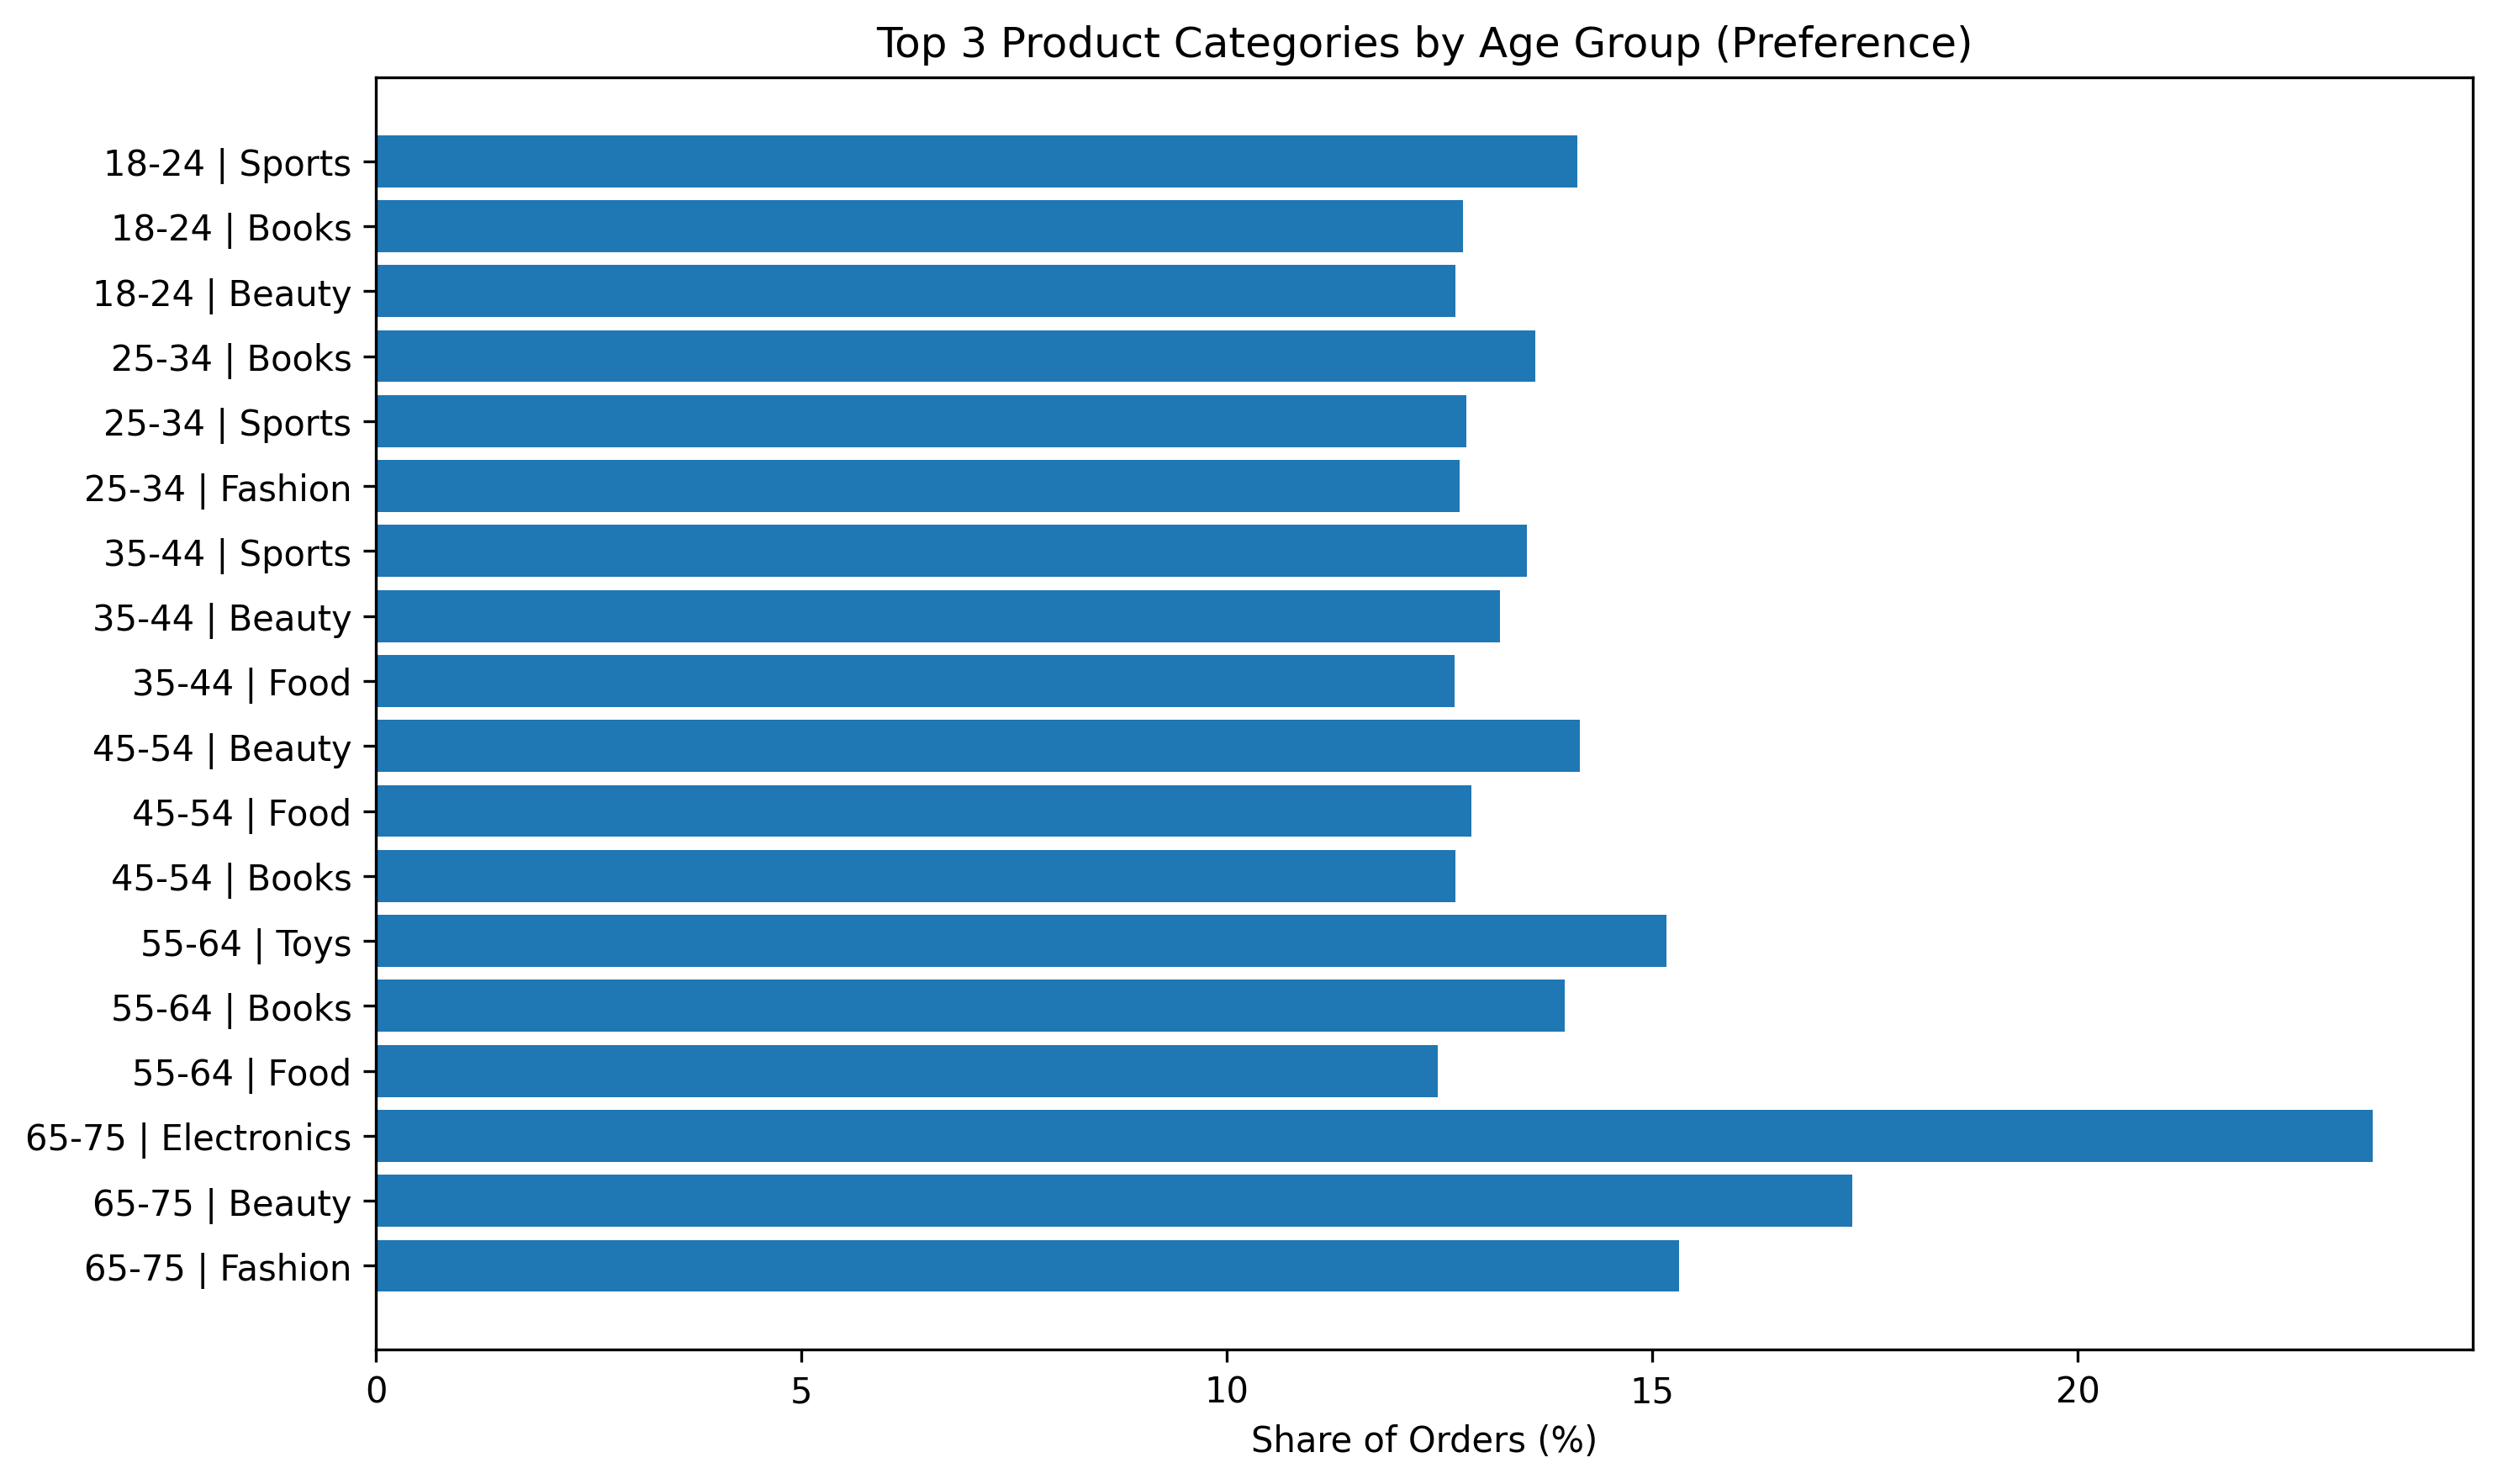
Preferences shift from broad interests to focused purchases with age
Age Group Category Preferences
Key Insights:
- Younger groups (18-34) prefer Books, Sports, and Beauty products
- Middle age groups (35-54) show balanced preferences
- Older groups (55+) concentrate on Electronics and Home essentials
Performance Metrics
Real data from comprehensive analysis
Revenue Share by Age Group & Category
Top categories per age group (scroll for more)
| Age Group | Product Category | Revenue Share (%) | Orders | Trend |
|---|
Showing top 5 rows per age group. Scroll within the table to view more data.
Category Performance Scores
Composite scores combining revenue, rating, and delivery performance
| Rank | Category | Revenue Score | Rating Score | Delivery Score | Overall Score |
|---|
Overall Score = Average of Revenue, Rating, and Delivery Scores
Age Group Category Preferences
Order distribution and share percentage by age group
| Age Group | Product Category | Orders | Share (%) | Rank |
|---|
Showing category preferences by age group based on order distribution